KISTERS datasphere, your smart environmental data hub.
Environmental intelligence, connected and simplified in an intuitive and flexible, cloud-based platform.

See more than data. Understand it. Act on it.
KISTERS datasphere brings past, present, and forecasted data from multiple sources into one intuitive cloud platform — so you can see more, understand faster, act with confidence. Track water levels. Monitor sensor networks. Compare sites. No coding. No installs. No rigid tools. No paying for modules you do not need. Just smart insights — from day one, and ready to grow with you.
Download the brochureAll your data. One platform.
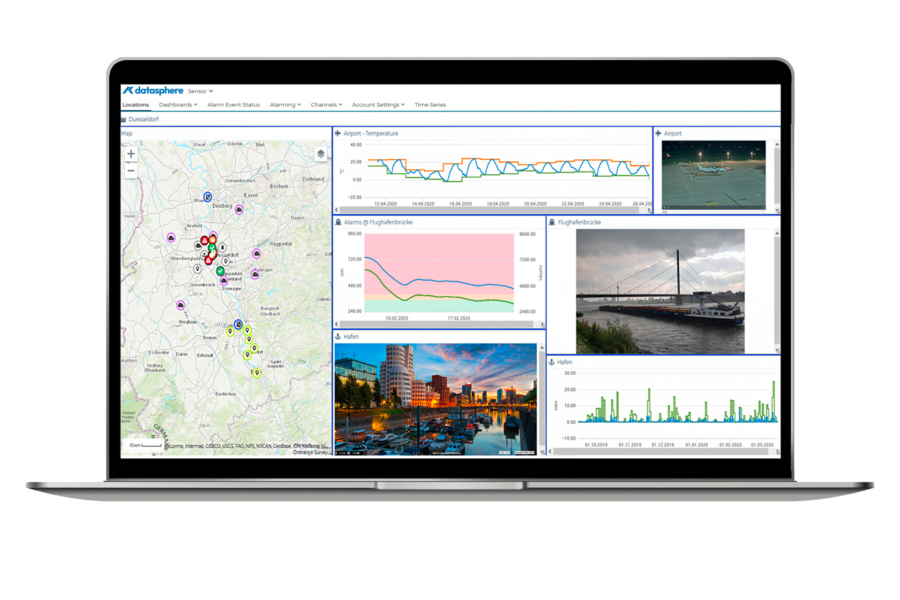
A top-ranked data-agnostics platform.
Unlike other platforms, Datasphere isn’t limited to a specific niche. Its data-agnostic design allows integration of any data type. Bring together sensor feeds, third-party data, and forecast layers.
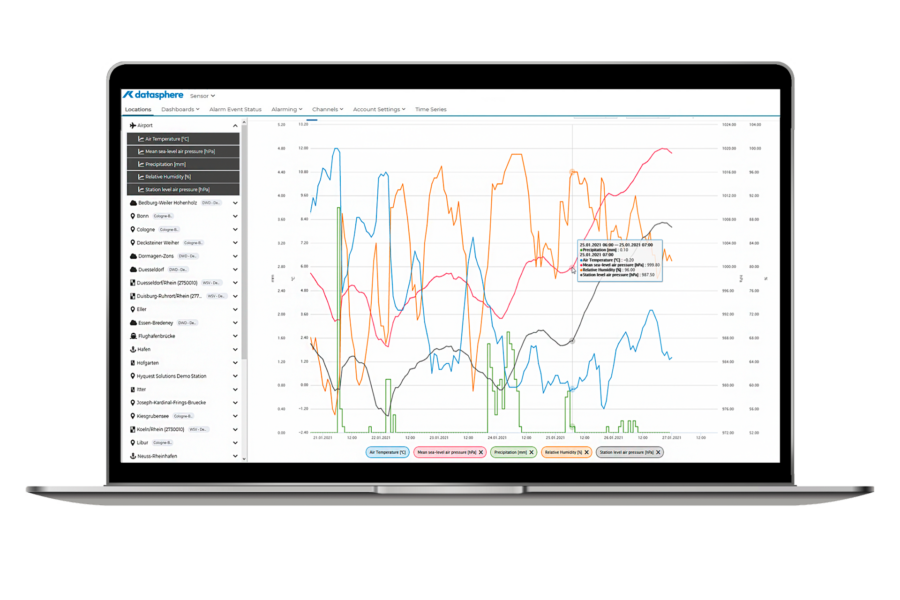
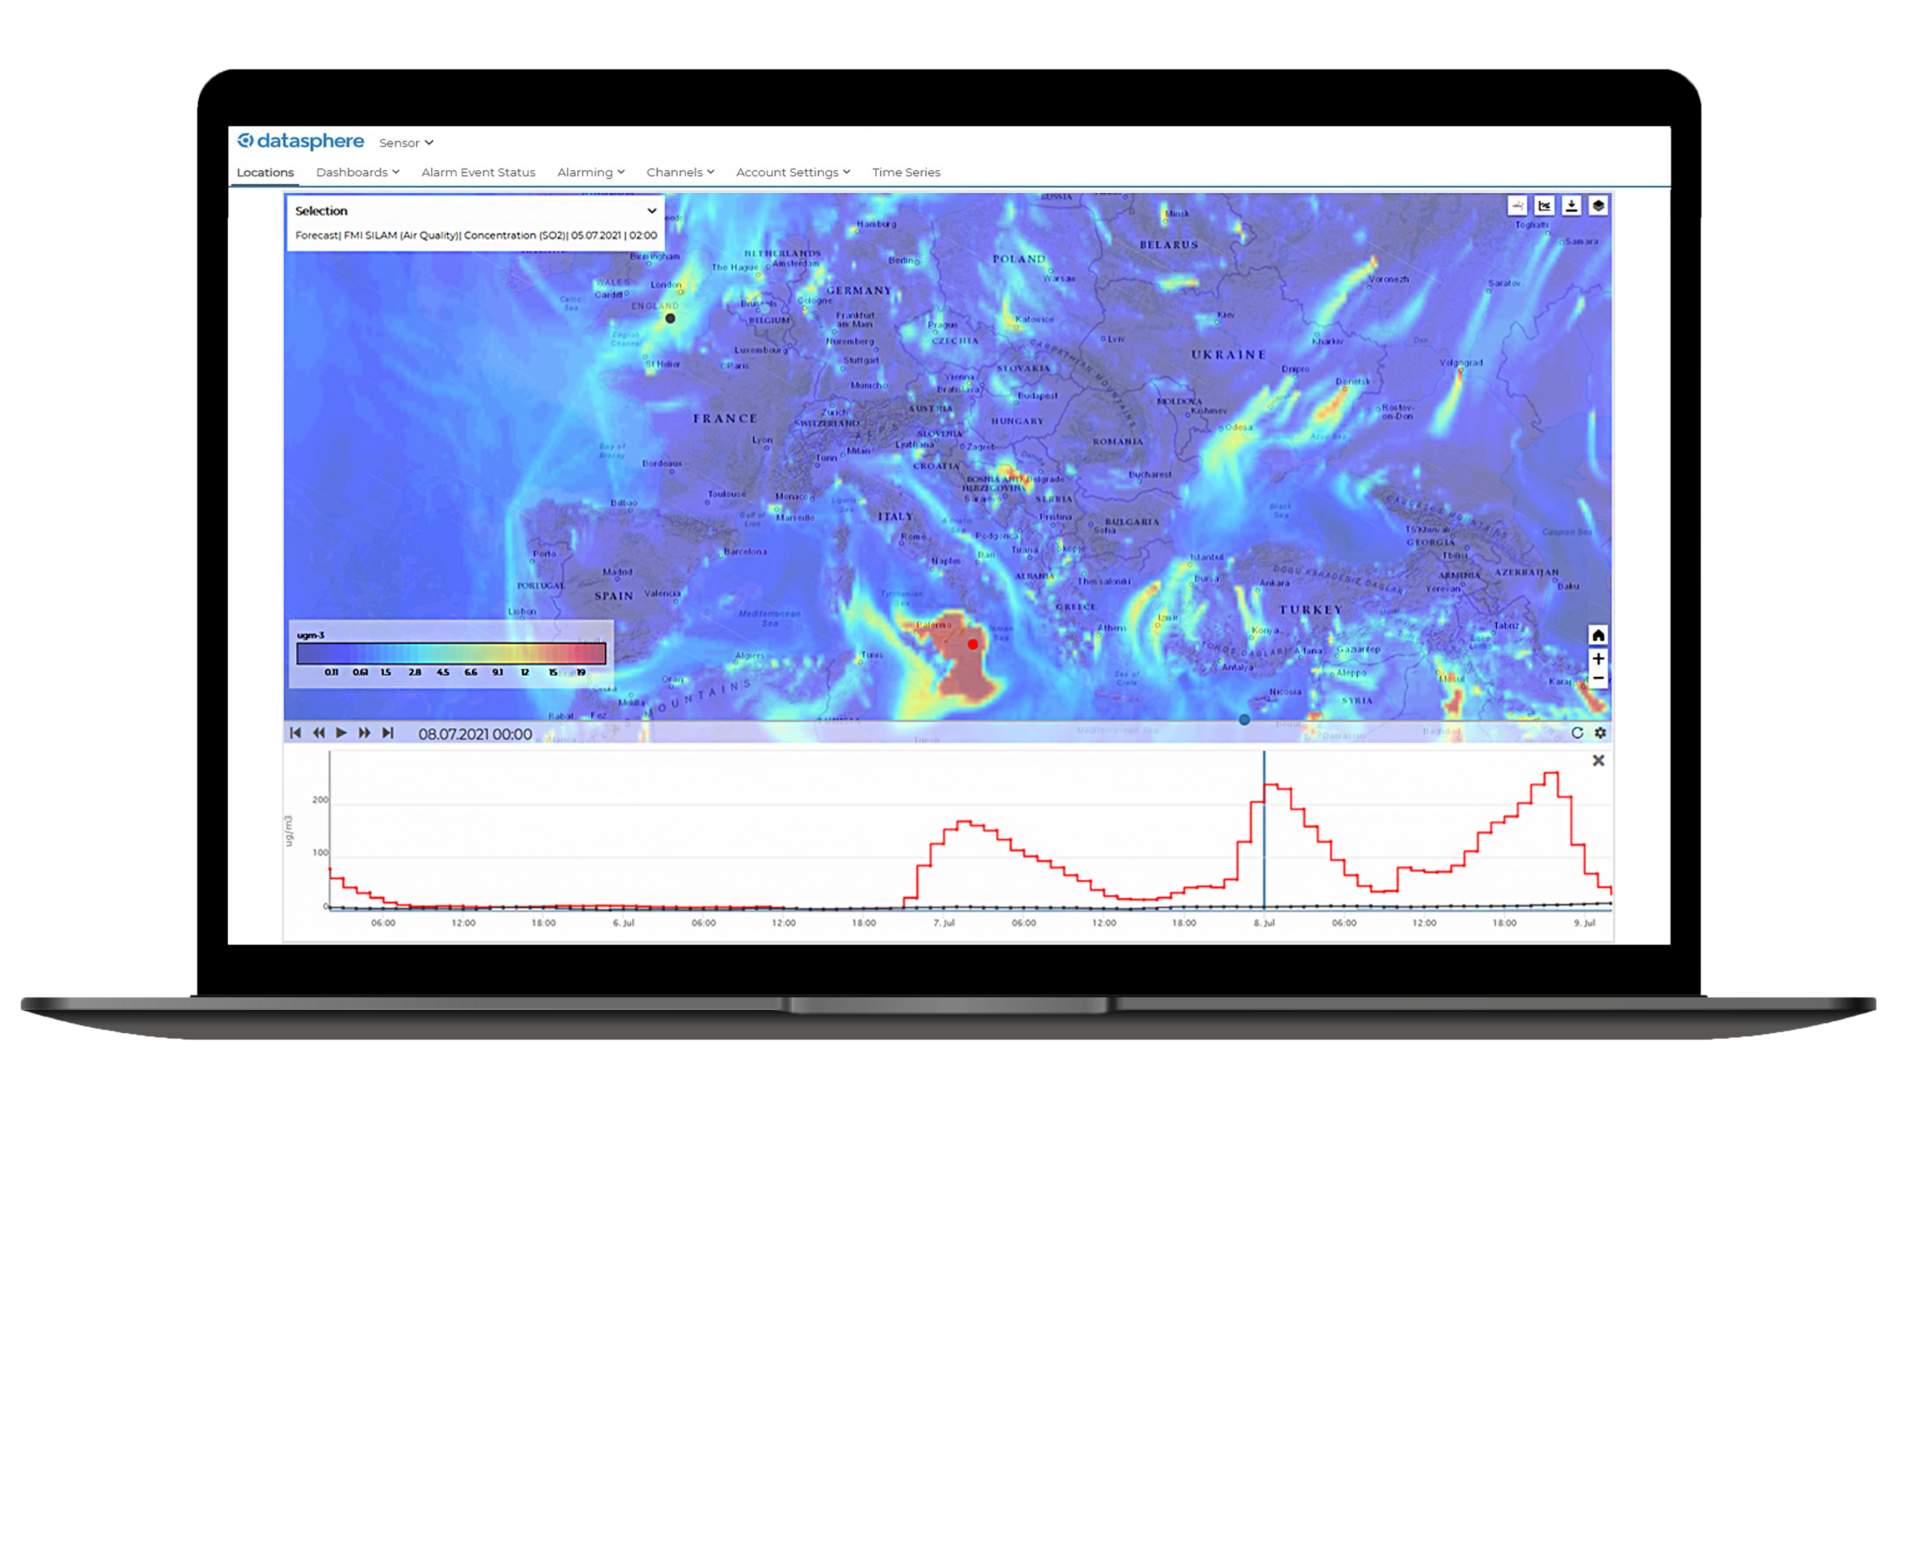
Full-spectrum visualisation.
Make better decisions faster.
Go beyond line graphs. Use comparative, real-time, and customisable visualisation tools— from GIS map views and dashboards, to forecast overlays and trend analysis. Get station-level access, overlay multiple data series in a single graph (i.e. rainfall data with level data, or forecast data with sensor data) and access recent and historical data all at once.
Don't miss a thing.
Act before issues escalate.
Logging, reporting, and alerts are fully automated. Set threshold-based alarms and receive notifications via email, SMS, or WhatsApp channels. Built-in red–amber–green indicators show risk levels at a glance, helping teams act early. Whether in the field or office, everyone gets the views they need.
Modular & no-code architecture.
Want to do more?
All tools are built for operational teams — no coding needed. Unlock advanced modules only when needed, with no upfront commitment. Set alarms, share data, automate via API, or add forecasting for hail, frost, floods, and more.
Learn more.


850+
Trusted by 850+ organisations across 30 countries, including governments, NGOs, private companies.
40000+
Capturing data in 40,000+ locations worldwide.
50000+
Access to 50,000+ unique time-series data in EMEA alone.
Key features.

KISTERS datasphere supports...
- Utilities and infrastructure operators
- Government and public agencies
- Environmental and research organisations
- Industrial operations
- Agriculture and irrigation management
- Emergency management and risk mitigation
Configured to your needs.
Our full range of extensions offer specific solutions to meet your needs and preferences. Arrange a consultation and we’ll identify a tailored solution for your organisation.
Add-ons.
Get notified before conditions become critical – with threshold-based, real-time alerts.
With Advanced Alerting Module

Get notified before conditions become critical – with threshold-based, real-time alerts.
Advanced Alerting Module
- Works with any sensor or forecast data ingested into Datasphere
- Supports red-amber-green alert levels
- Thresholds easily configured by parameter or location
- Email notifications with flexible group delivery
- Optional module in KISTERS datasphere
Contact us for more information Watch a demo
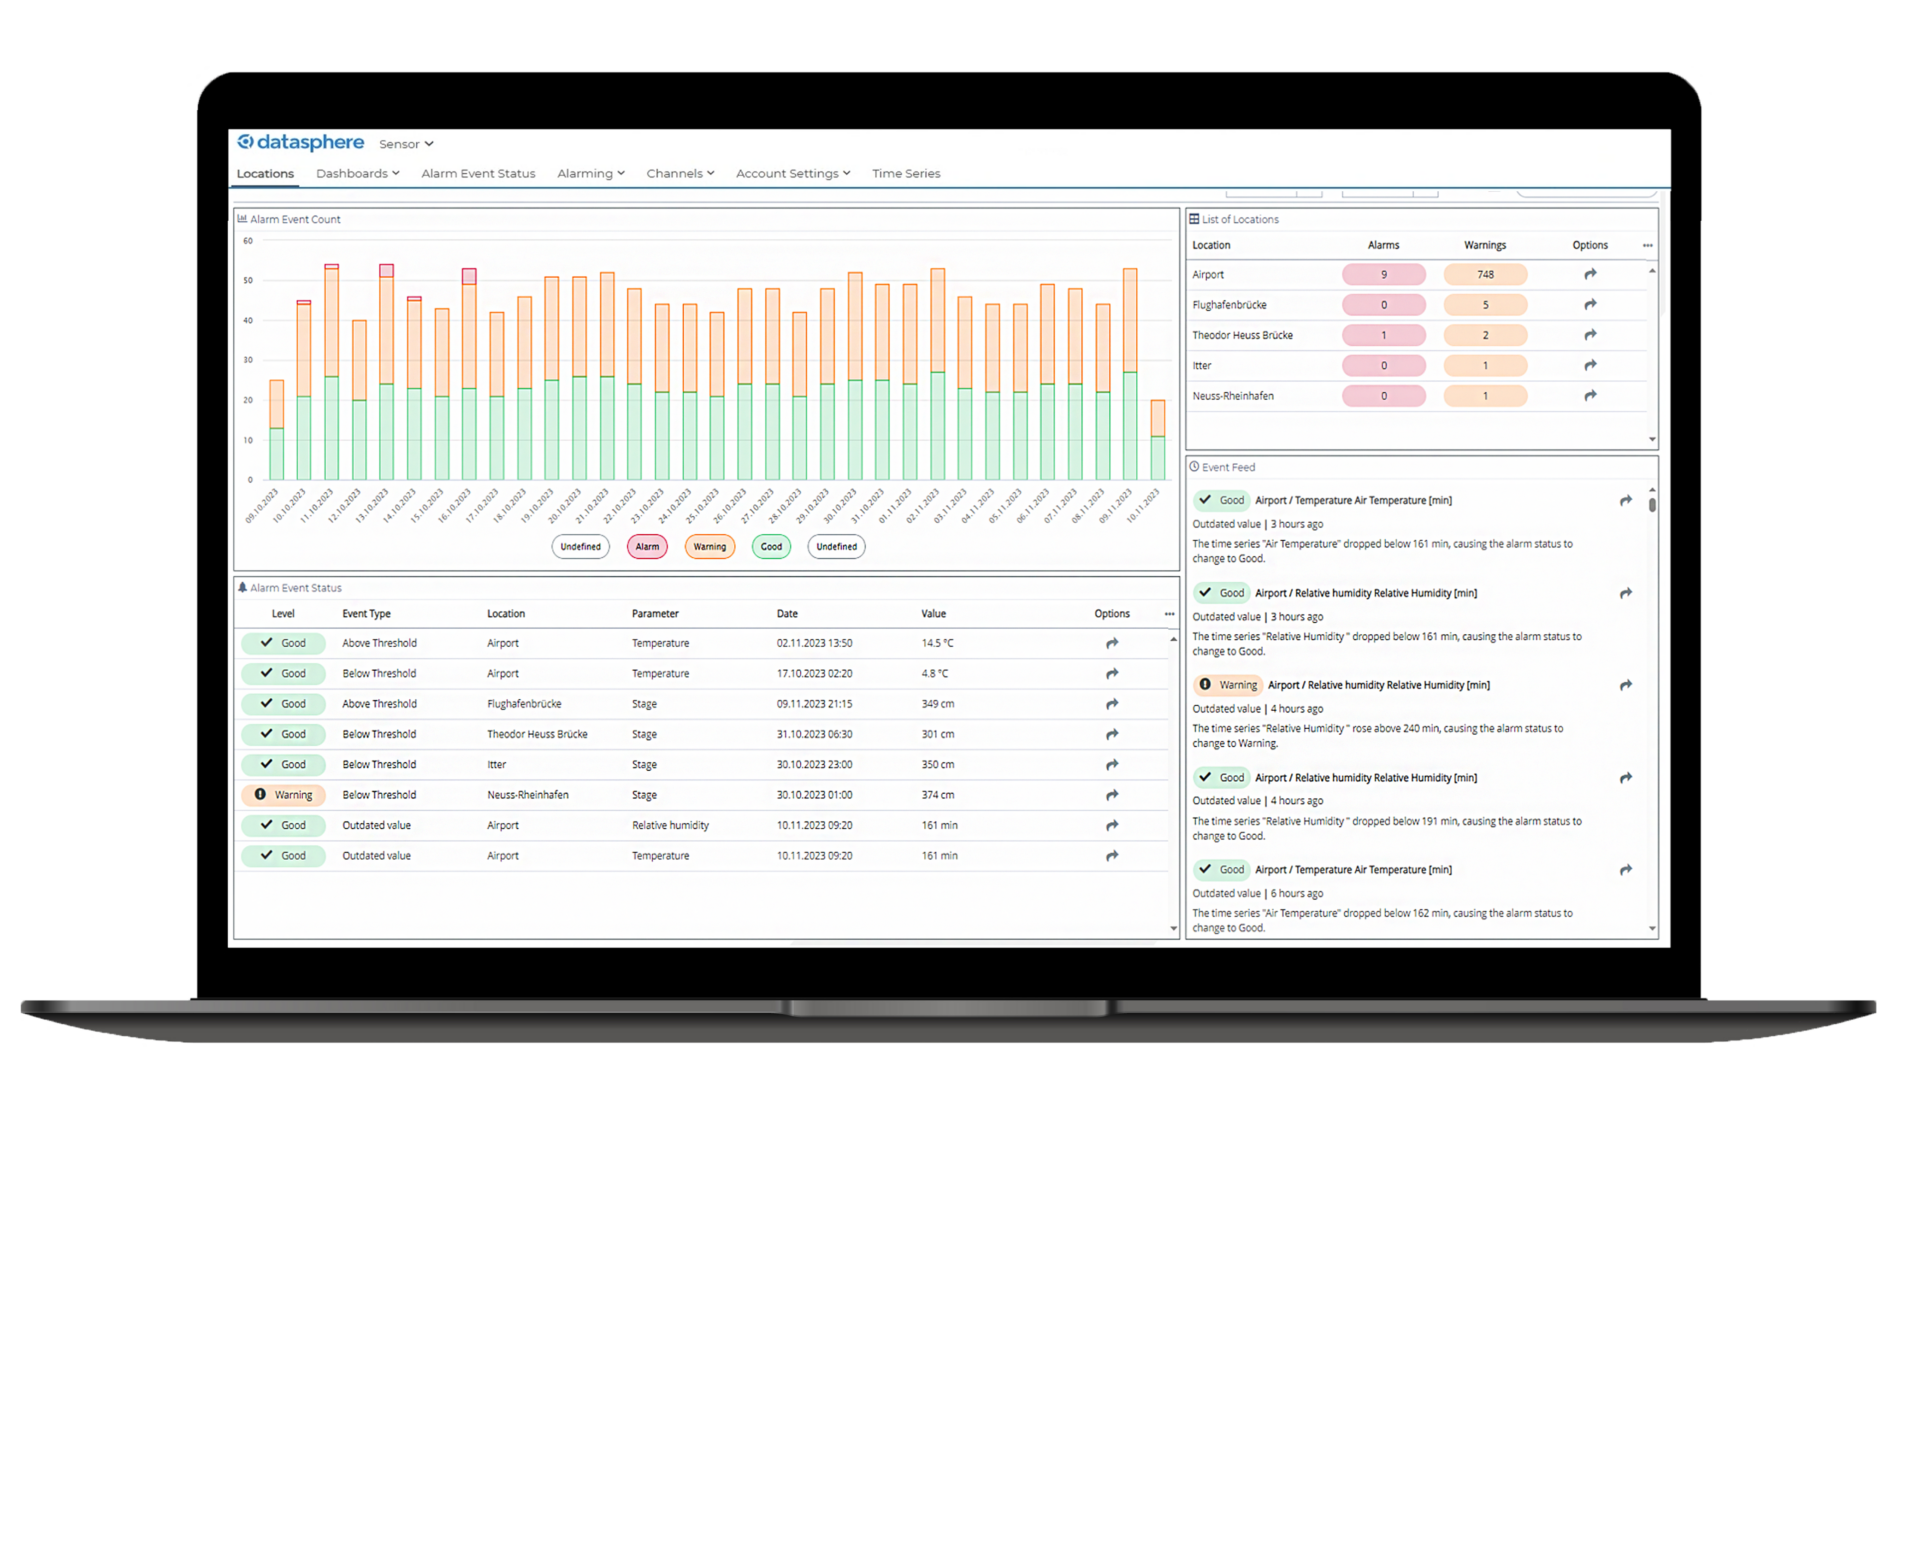
Alarm event count chart – red-amber-green alerts.
Support early decisions in frost-sensitive areas.
With RoF - Frost Risk Module

Support early decisions in frost-sensitive areas.
RoF – Frost Risk Module
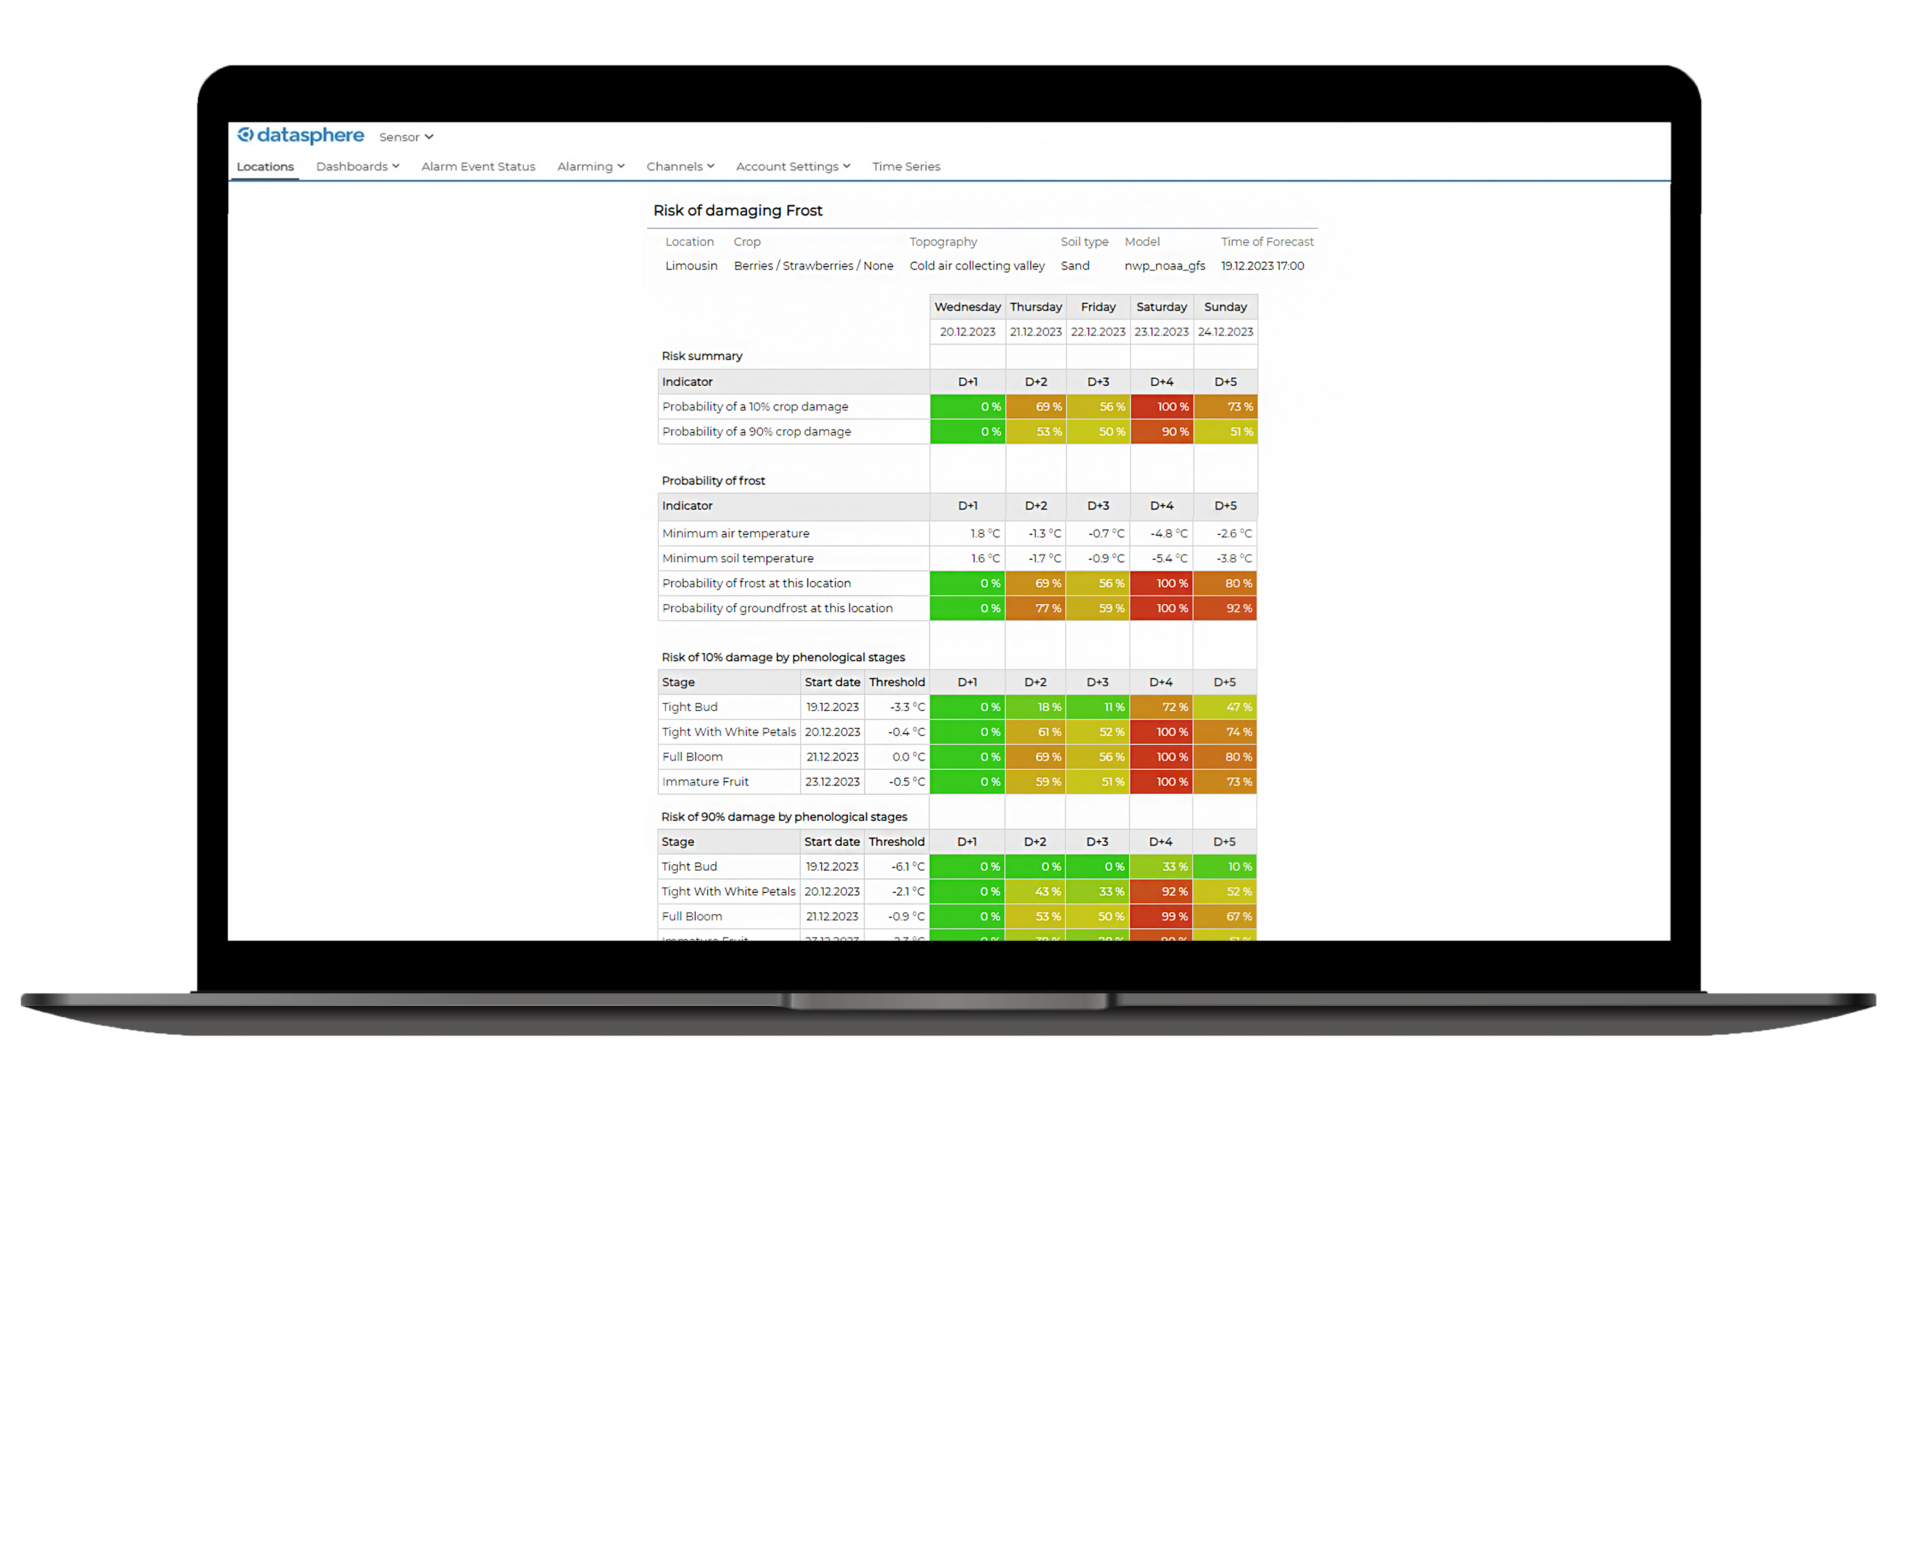
The frost module provides real-time risk indicators based on hourly forecasts, temperature trends, and expected thresholds.Use it to activate protection systems, or alert stakeholders in time. Protect crops and assets with localized frost forecasts and real-time insights.
- Crop- and growth stage-specific frost thresholds
- Up to 5 days forecasts using regional and global models
- Risk levels visualized by zone and mapped across sensor locations
- Real-time sensor data integration for better decisions
- Adaptable to regional frost thresholds and crop needs
- Powered by KISTERS datasphere
See the product literature Ask about frost protection tools Watch a demo
Risk of damaging frost – probability based on 10% resp 90% damage thresholds reached in a 5-day forecast period
Optimise water use and plant health with automated irrigation insights.
With Irrigation Recommendation Module
Optimise water use and plant health with automated irrigation insights.
Irrigation Recommendation Module
Turn evapotranspiration and precipitation data into action. The irrigation add-on estimates soil moisture conditions and daily crop water needs to support smarter irrigation planning.
- Crop-specific insights
- Based on weather forecasts, soil type, and crop-specific parameters
- ETa-based irrigation forecasts tailored to crop type and soil
- Automatic integration of weather and soil moisture data
- Easy-to-interpret dashboards and irrigation alerts
- Powered by KISTERS datasphere
See the product literature Ask about Irrigation Recommendation Module Watch a demo
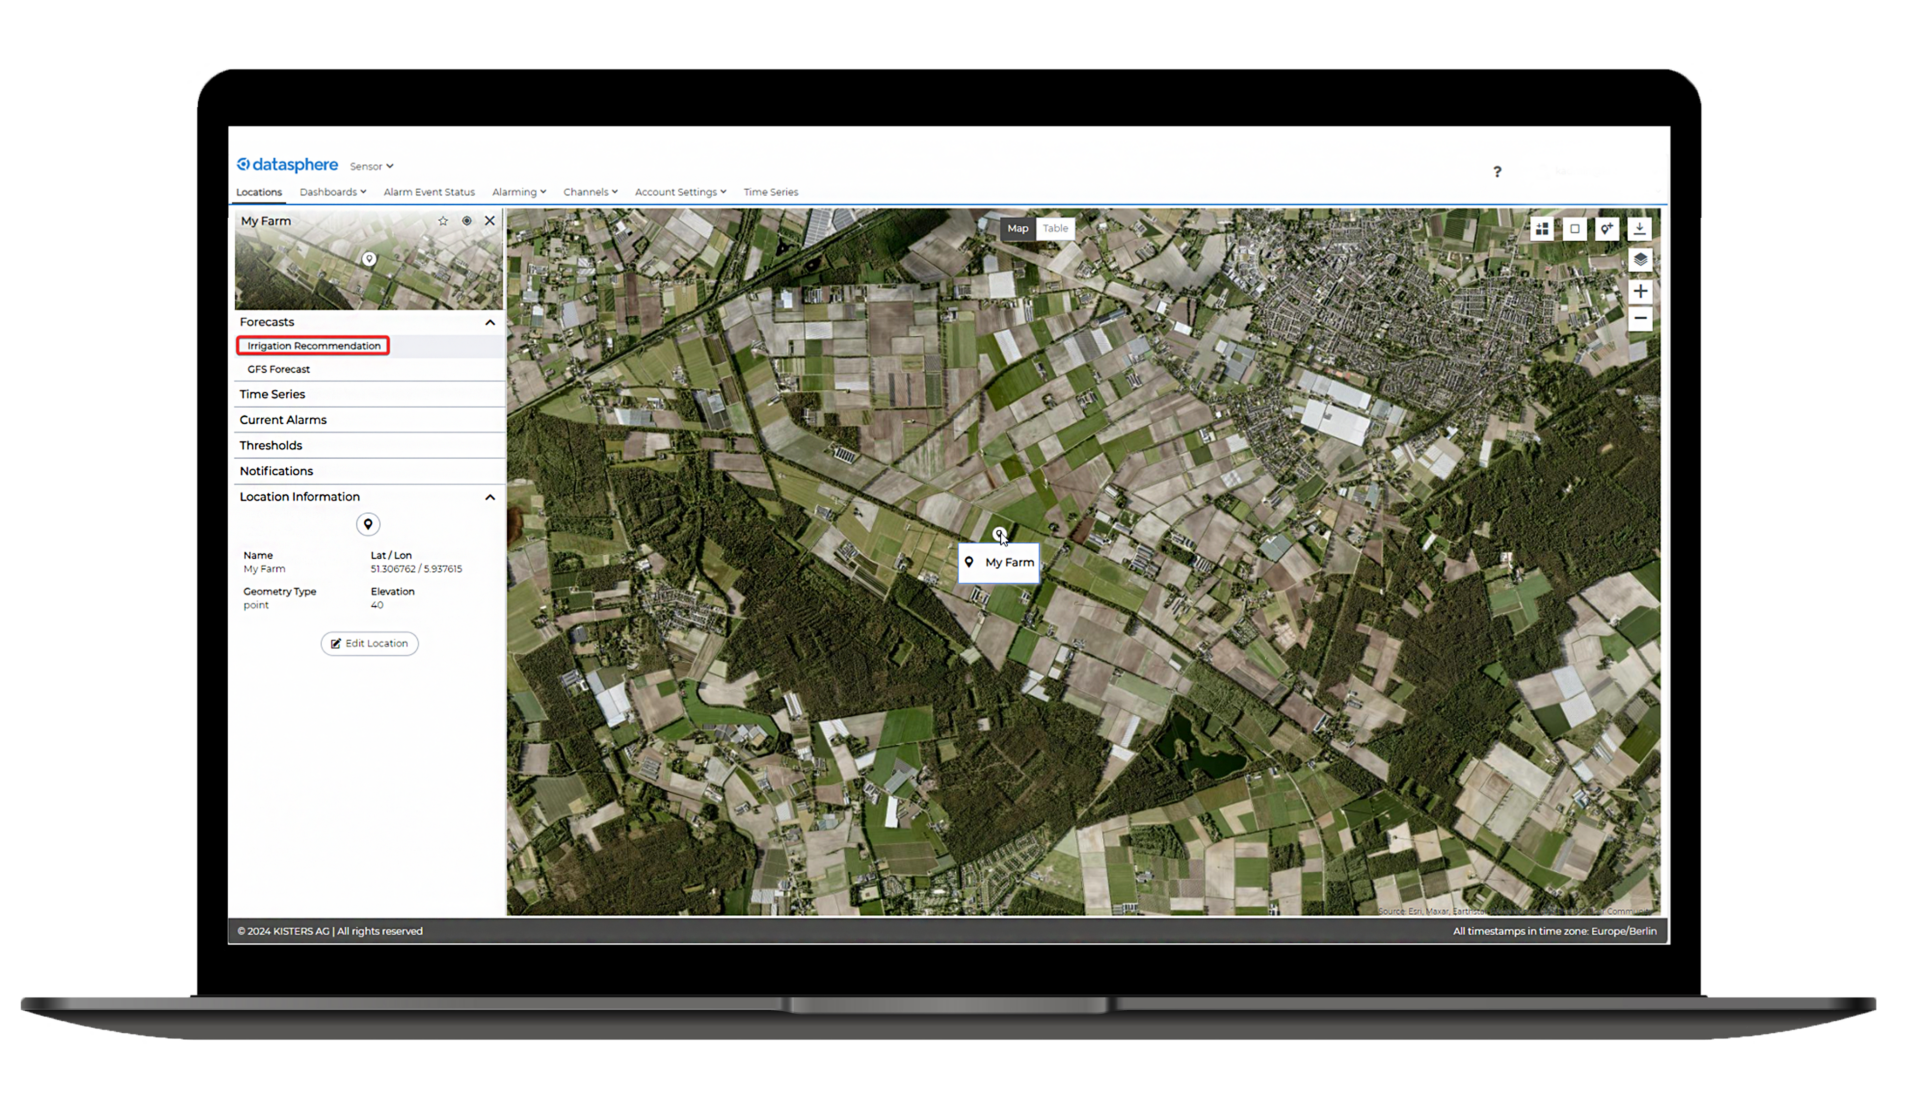
Irrigation recommendation GIS view.
 Precipitation forecast and planned gross irrigation chart.
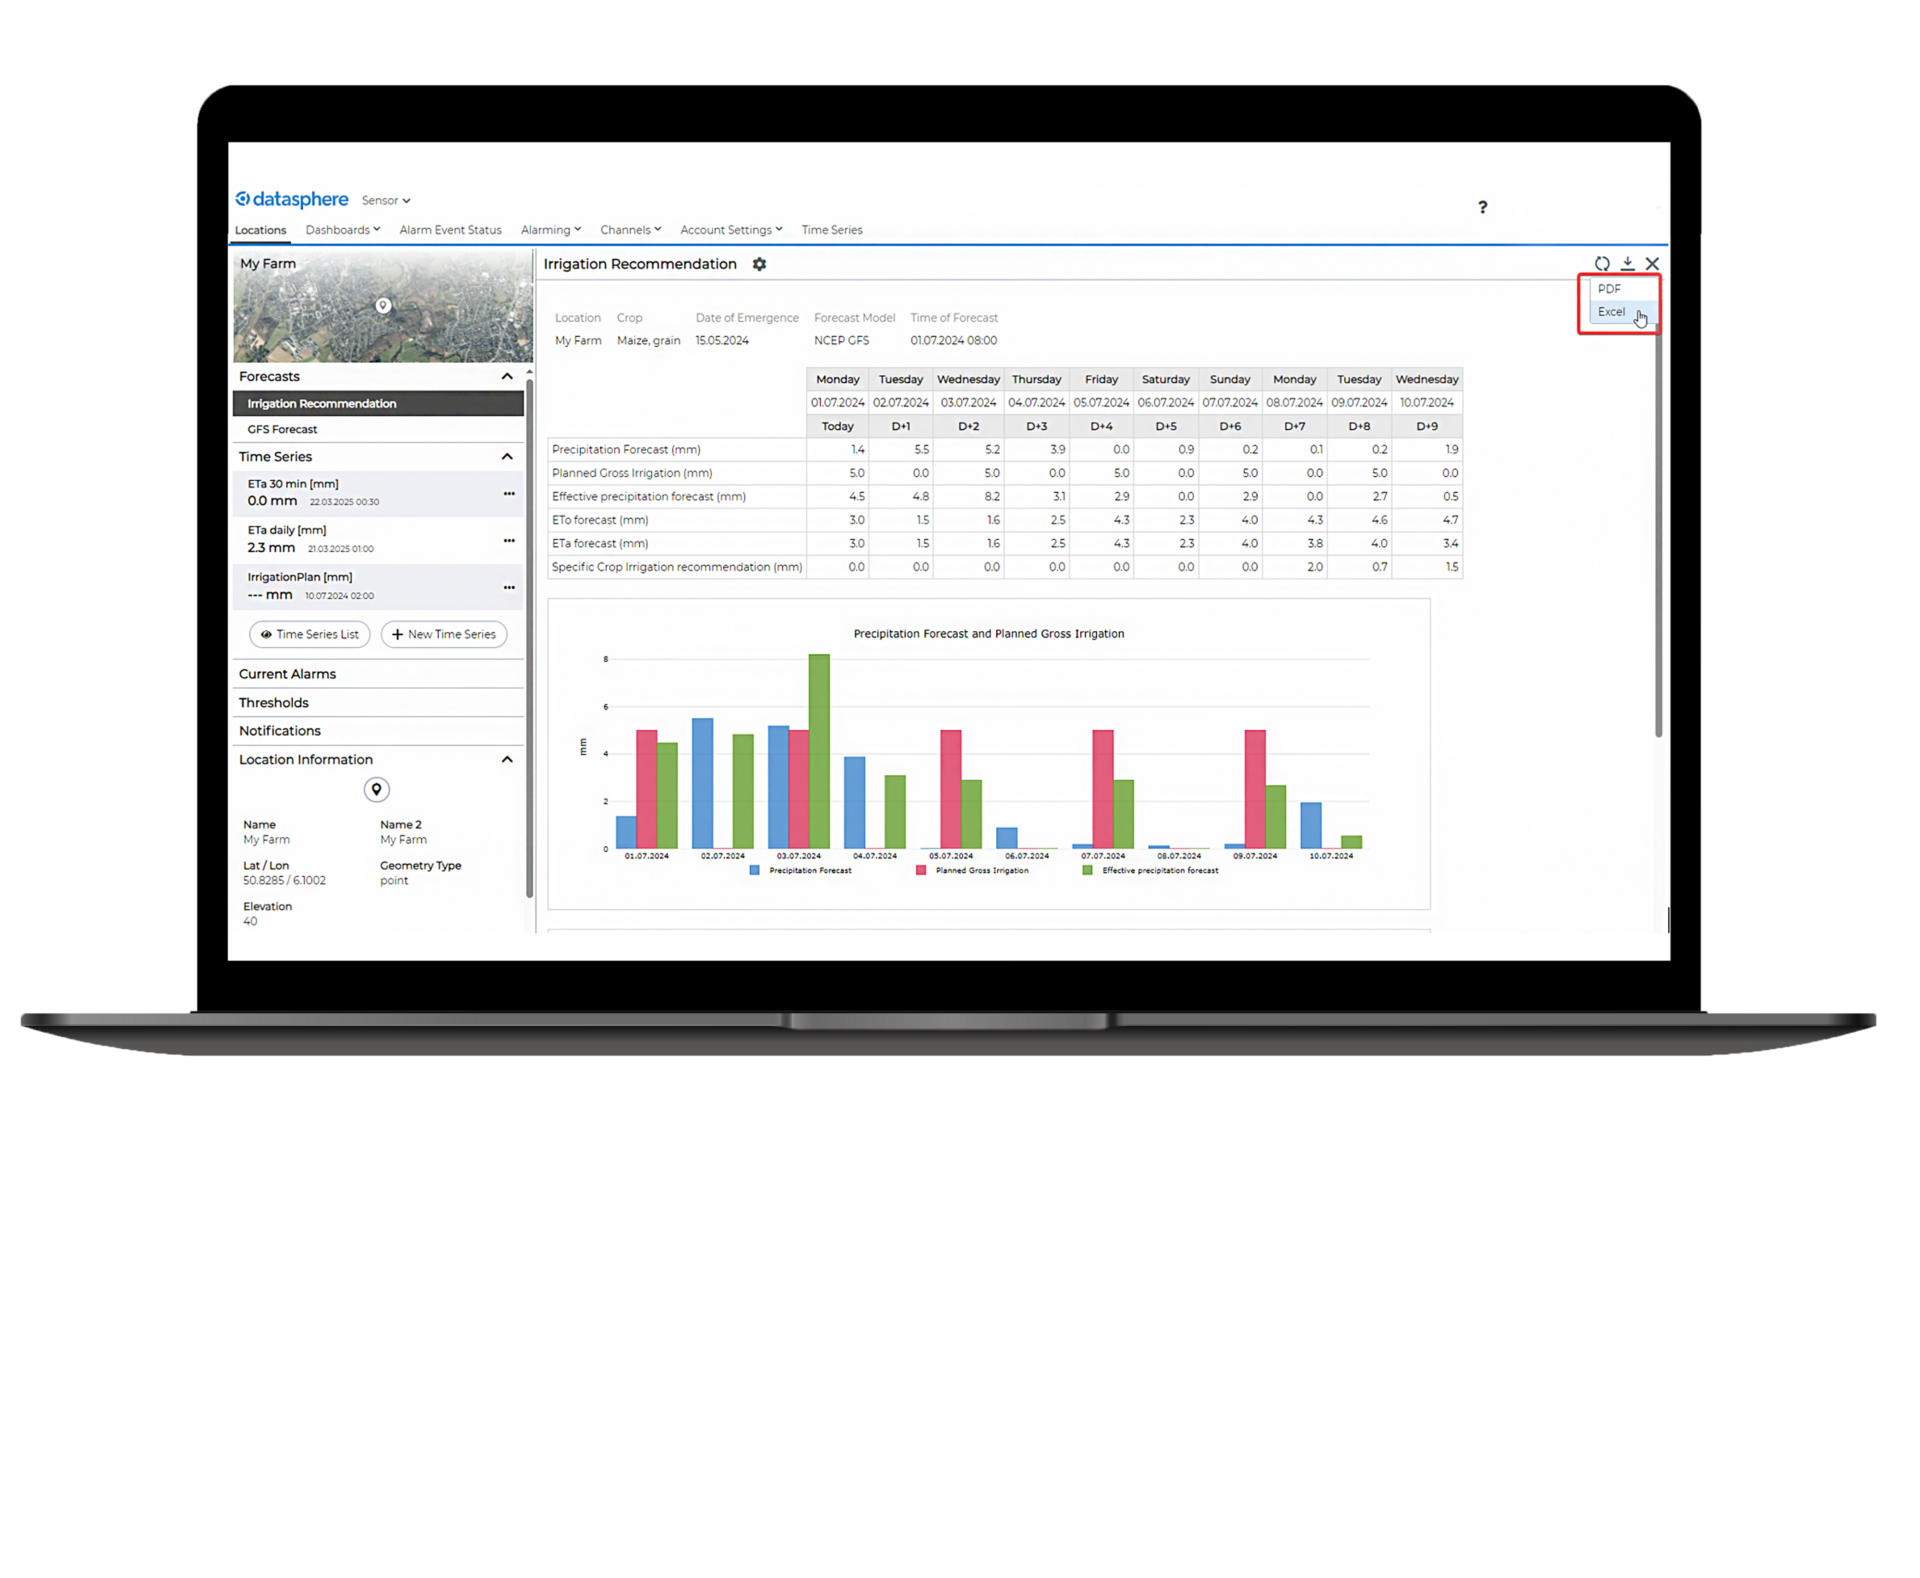
Visualise complex weather patterns with enhanced forecasting layers from multiple open data weather models like NCEP GFS, ECMWF Control Runs and EPS, DWD-ICON EU and many more.
With Raster Viewer Module

Visualise complex weather patterns with enhanced forecasting layers from multiple open data weather models like NCEP GFS, ECMWF Control Runs and EPS, DWD-ICON EU and many more.
Raster Viewer Module
The Advanced GFS module gives additional access to atmospheric and upper-air forecast data in tables— helping you better predict storms, hail events, temperature shifts, and more.
KISTERS datasphere integrates these layers seamlessly into your dashboards and maps, that enables better planning for weather-sensitive operations.- All powered by KISTERS datasphere.
Ask about Raster Viewer Module Watch a demo
Raster viewer – forecast concentration map.
Securely connect, publish, and automate data flows – without manual work.
With Advanced Data Access, Publishing & Exchange Module

Securely connect, publish, and automate data flows – without manual work.
Advanced Data Access, Publishing & Exchange Module
This module expands KISTERS datasphere’s interoperability, allowing you to automatically import and export data, push to external systems, or access real-time feeds through secure APIs.
Ideal for organizations needing reliable data exchange with internal or third-party platforms.- Automated data import/export via API
- Secure API integration
- Flexible publishing to external databases or endpoints
- Reduces manual file handling and errors
- Supports transparency, regulatory reporting, or third-party sharing
- Powered by Datasphere
Ask about Advanced Data Access, Publishing & Exchange Module Watch a demo
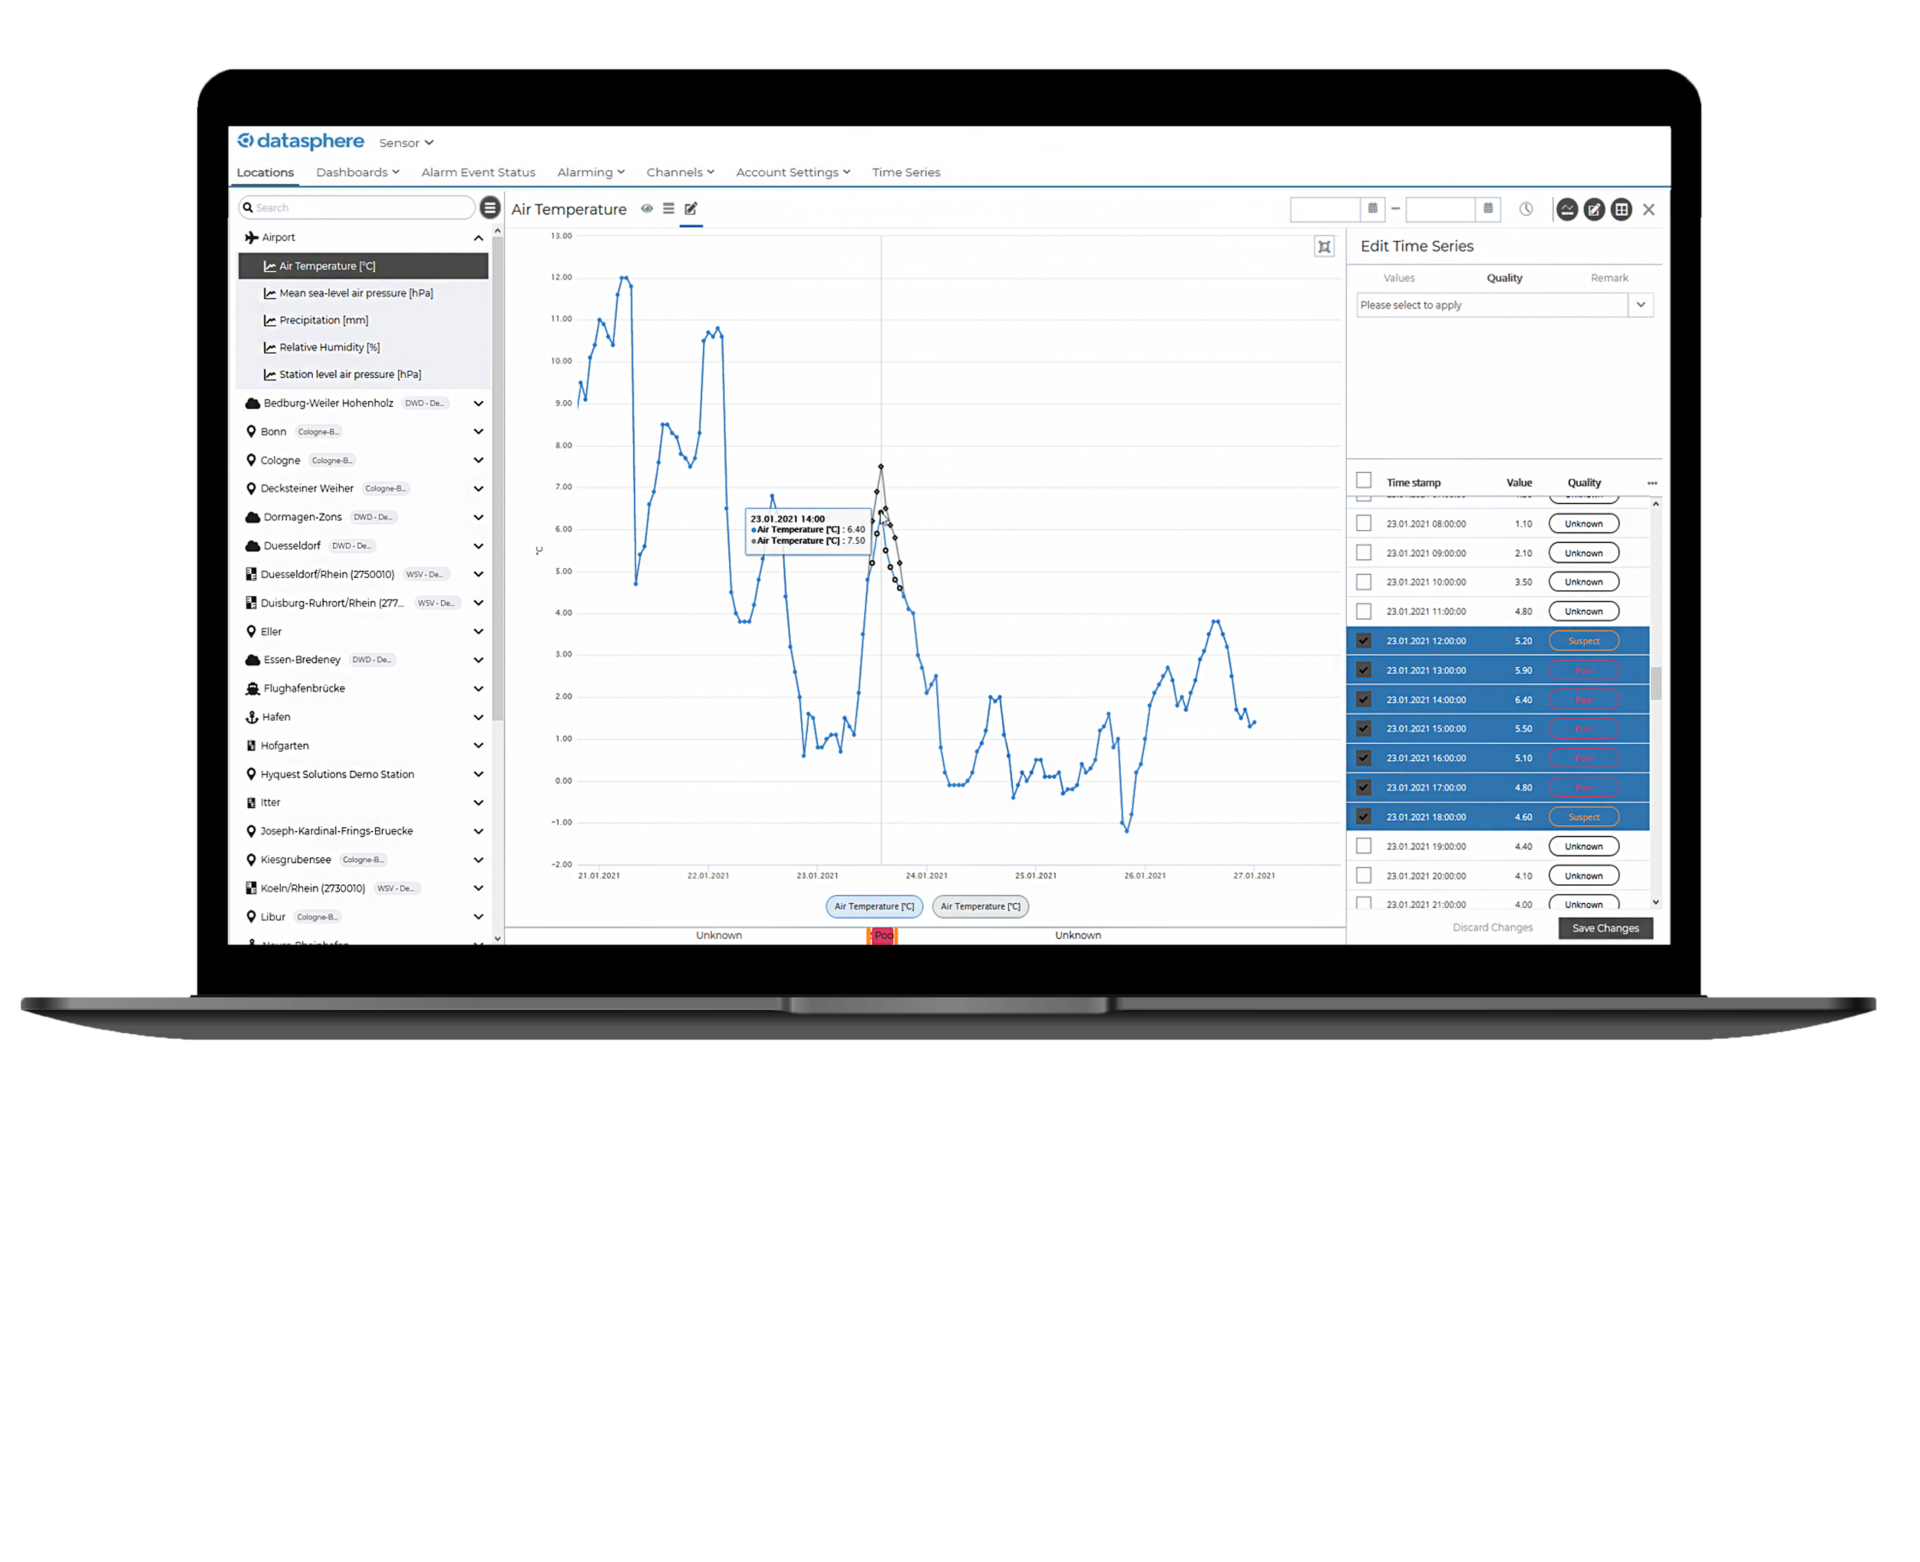
Manual error correction for QA/QC example chart.
Learn more about KISTERS datasphere.

Customer Success Story: England’s Most Digitally Connected Water Catchment.
Six agencies, one vision: The Blue Heart project in East Sussex, England uses KISTERS Datasphere to unite 495+ live sensors, cross-agency data sharing, and automated flood alerts. It’s setting a new benchmark for water resilience in the UK.
Customer Success Story: Hillingdon Lighthouse: Smarter Flood Response in England.
In Hillingdon, England, KISTERS datasphere delivers real-time rainfall and water level insights. Accurate forecasts and live data empower faster decisions, better resource allocation, and stronger community resilience.
Read the Hillingdon Case StudyFAQs.
What is KISTERS datasphere in a nutshell?
KISTERS datasphere is a cloud-based platform for centralising, monitoring, and analysing environmental data. It brings together real-time, recent, historical, and forecast data — with intuitive dashboards, customisable alerts, and powerful visualisation tools — helping you transform raw data into actionable insight.
What kind of data can Datasphere integrate?
Datasphere acts as a central hub for real-time sensors, data loggers, weather raster data, camera imagery, and open or commercial sources. It lets users visualise trends, overlay multiple datasets, and monitor multiple locations side-by-side — all in one platform.
What features does Datasphere offer for analysis and collaboration?
Datasphere includes customisable dashboards, graph overlays, colour coded threshold alerts (email/group), historical data ff, basic statistics (min, mean, max), dynamic logging, and GIS-based map visualisation. Optional add-on modules extend capabilities with forecasting, advanced alerting, and automated data publishing.