Data management & Reporting
Store, manage and process environmental data for reporting & informed decisions
Configurable & robust data management systems that scale to your needs
Distilling the most value from past and present environmental monitoring data as well as emerging trends is key to managing natural resources, population growth, and operating with resiliency. Whatever we monitor — weather, water, soil, or ecological data and metadata — must be reliably collected, managed, and processed for analyses and use.
Our comprehensive & flexible data management systems help small and large organizations alike because they’re designed to build up self-sufficiency. Standard functionality help you store, access, edit, transform, visualize, report and publish data from your monitoring of water, weather and the environment.
The diversity of our expertise, customers and success stories are likely to help you accomplish your data management goals.
Your benefits
Implementing a data management system that works for you
Our systems are designed to meet your needs today and into the future, giving you long-term sustainable data management and self-reliance.
All the while, we’re committed to your success from scoping your IT needs to providing customer and technical support.
Product category highlights
Robust, secure, and high-performance storage & analytics

Robust, secure, and high-performance storage & analytics
With more than 60 years in environmental data management, we have developed comprehensive and, above all, reliable and efficient databases with powerful calculation engines.
Well-designed solution architecture provides unlimited storage capacity for an unlimited number of parameters, so your system scales as you collect more data over space & time. Furthermore, all original / raw data are stored separately from edited data to maintain data integrity.
We can import, store, and process your data fast and properly.
Flexible data acquisition options

Flexible data acquisition options
In addition to our data acquisition & telemetry solutions, our data management systems are enhanced and continually tested to ensure the successful import of data from nearly every sensor regardless of the manufacturer and type of data source.
Additional software and APIs may be used to acquire information from other data sources as well as migrate historical data.
We can help you overcome almost every limitation imposed by different file formats.
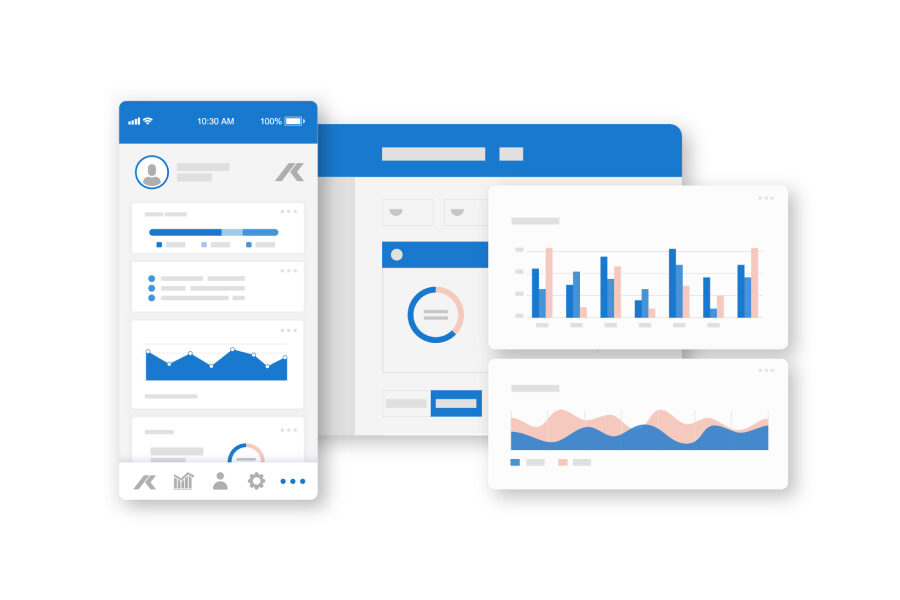
Advanced graphing & data visualization
Advanced graphing & data visualization
As a tech company, we love the ability to perform powerful calculations. And we also know to be data-driven requires presenting data in meaningful ways for its use by employees, our best assets and yours.
To maximize your use of data & our analytical tools, we’ve made advanced graphing and data visualization a key component to our data management systems. The feature supports mapping, QA/QC activities, and navigation within the system. You’re empowered with highly efficient abilities to load multidisciplinary data of interest for time periods of interest, from centralized and integrated data sources.
Discharge measurement & Rating curve tools

Discharge measurement & Rating curve tools
While we’re an IT company, our hydrology expertise and hydrology-specific applications, embedded in our data management systems, set us apart.
Use the discharge measurement application as easily in the field as in the office. It’s compatible with all conventional Acoustic Doppler Current Profiler (ADCP) and streamflow measuring devices from major suppliers. Manual collection requires minimal data entry after returning to the office. Regardless of your measurement method, our data management & analytics platforms support fast, convenient calculations. Review and integrate results into your own stage / discharge rating curves.
Pro tip: The same data system helps you manage your inventory of sensors, current meters, other discharge measurement devices and their calibration equations and counters. Configure your current meter from a selection of propellers, current meter bodies and center pieces and simply enter your calibration equations.
Use the stage-discharge rating curve application to create, manage, and optimize non-linear conversions of hydrological input parameters. Compare stage and flow to determine the presence and effect of erosion or sediment deposit at the stage measurement site. Apply to both natural flow cross-sections and control cross-sections (e.g., USGS methods). This tool allows stage-discharge curve creation using hysteresis or other complex methods. Also, use the rating curve editor to construct elevation-storage curves for lakes and reservoirs and plan for water storage.
The following methods for the creation of rating curves are supported:
- Interpolated Skeletal Points (USGS)
- Single point method with spline interpolation
- Power law method with and without zero offset
- Power law method in sections
- Predefined weir functions (e.g. V-notch weir)
- Formula editor for functions that can be defined freely
User administration controls

User administration controls
21To uphold security, our systems empower system administrators to approve users and assign them with varying levels of data access and functionality to either user groups or individual users.
Audit trail reports allow administrators to investigate user & data activities as well as track system statuses to ensure data users can have confidence in the information they use to make decisions.
Esri arcGIS integration

Esri arcGIS integration
Integrate geo-referenced data with time series information to better visualize trends. Explore problems and/or progress occurring within a particular station, user-define group of stations, state or region. The combination of market-leading GIS tools and data management technologies empowers users to simultaneously view, query, and perform complex operations on data from multiple stations. Create static or animated maps for reports, websites and presentations.
WISKI Extensions / Plugins for ArcGIS and ArcGIS Pro
WISKI Arc extensions and plugins easily provide access to information secured in KISTERS data management systems. Esri GIS users can readily discover, analyze, report and share insights. KISTERS plugins show WISKI navigation tree views within the Esri desktop application. Directly access WISKI data – station basic data, time series, and quality samples – for analysis and viewing with extensive GIS functionality.
The barrier-free integration with GIS enables geospatial analysts to load current data values as symbols for a specified time series group within the ArcGIS session. Also digitize and adapt station coordinates on the basis of available background maps if no measured coordinate information is available.
This option is highly recommended for agencies with users highly skilled in GIS. It saves considerable time as these professionals extend the value of ArcView, ArcGIS or ArcGIS Pro interfaces, and won’t need to learn to navigate the WISKI user interface.
WISKI Web Mapping
Using the ArcGIS Javascript API, WISKI Web products provide high-quality mapping tools within an online interface. The API allows KISTERS to embed maps in the WISKI Web solution, so users can visualize time-aware data using the TimeSlider widget.
Remote hosting & cloud compatible

Remote hosting & cloud compatible
Based on the availability of dedicated IT resources at your organization, you may opt to deploy our software in our private cloud or a commercial cloud such as Amazon Web Services (AWS) or Microsoft Azure.
With Internet access and authorized system access, end-users and system administrators alike can enjoy all of the benefits of our data management system without the complexity and challenges of IT ecosystem ownership.